
Conservative
$0.00 /month
$0.00 /year
A tighter budget that leaves extra room for savings, debt payoff, or a high cost-of-living area.
Work out how much rent you can actually afford. Enter your salary, monthly income, or hourly wage and get a recommended rent budget across four tiers, built on the same 30% affordability standard the federal government uses to define "cost burdened" housing.
Gross monthly income: $0.00
Conservative
$0.00 /month
$0.00 /year
A tighter budget that leaves extra room for savings, debt payoff, or a high cost-of-living area.
Recommended (30% Rule)
$0.00 /month
$0.00 /year
The federal government's own affordability line. Above this, a household is officially "cost burdened."
Stretched
$0.00 /month
$0.00 /year
Common in expensive metro areas, but leaves less room for savings and unplanned expenses.
Severely Cost-Burdened Limit
$0.00 /month
$0.00 /year
HUD's "severely cost burdened" line. Treat this as a hard ceiling, not a target to aim for.
Based on the federal housing affordability standard described in the Congressional Research Service, "Housing Cost Burdens in 2023: In Brief". Figures use gross (pre-tax) income; your real take-home budget will be lower.
Based on Congressional Research Service, "Housing Cost Burdens in 2023: In Brief", not a guessed average.
This is a national income-share benchmark, not a location-adjusted one: it does not account for local rent levels. Check listings in your own market to see what your number actually buys where you live.
"Spend 30% of your income on rent" is the most repeated piece of budgeting advice there is, but most sources never explain where that number actually comes from or what happens once you cross it. This calculator uses the real federal standard instead of a vague rule of thumb: the same 20-50% income-share thresholds the U.S. government and Census Bureau use to classify housing as affordable, cost-burdened, or severely cost-burdened.[1]
The idea of tying rent to a share of income is old: reformers in the late 1800s and early 1900s used "a week's wages for a month's rent" as a rough affordability check.[1] Congress made it official policy with the Brooke Amendment of 1969, which capped public housing rent at 25% of a resident's income. The Housing and Community Development Amendments of 1981 and the Housing and Urban-Rural Recovery Act of 1983 raised that cap to 30%, where it has stood ever since.[1]
Federal housing policy still defines "affordable" as costing no more than 30% of income. Households paying more are officially "cost burdened," and those paying more than half their income are "severely cost burdened." In 2023, that meant 49.5% of U.S. renter households were cost burdened, and 26.5% were severely cost burdened.[1]
| Tier | Share of gross income | What it means |
|---|---|---|
| Conservative | 20% | Extra room for savings and debt payoff |
| Recommended (30% Rule) | 30% | The federal affordability line |
| Stretched | 40% | Common in expensive metro areas |
| Severely Cost-Burdened Limit | 50% | HUD's hard ceiling, not a target |
Enter your income above in whatever form you actually know it, annual salary, monthly income, or an hourly wage with your typical hours, and the calculator converts it to a gross monthly figure, then multiplies that figure by each of the four percentages above. There is no separate math for renters versus buyers or for different household sizes; the percentages apply the same way regardless of who is signing the lease.
This calculator estimates base rent only. It does not include utilities, renters insurance, parking, or moving costs, and it does not adjust for local cost of living: 30% of your income is the same dollar figure whether you live in a low-cost town or an expensive coastal city, even though that dollar figure buys very different apartments in each place. Treat the result as an income-based ceiling, then compare it against listings where you actually want to live.
Source: Congressional Research Service, "Housing Cost Burdens in 2023: In Brief".
The calculator gives you all four numbers at once, but most renters only need one for day-to-day decisions. Here is a simple way to pick.
You are prioritizing savings, paying down debt aggressively, or want a cushion in case your income changes. This is also a close match to Dave Ramsey's stricter housing guidance once you account for the gross-versus-net income difference.[2]
You want the same benchmark the federal government itself uses to define affordable housing. This is the right default for most renters comparing their situation to a national standard for the first time.
You live in a higher cost-of-living metro area where 30% is not realistic for the apartment size or location you need, and you are consciously trading a smaller savings margin for housing quality or commute time.
This is HUD's official line for "severely cost burdened," the point where more than a quarter of U.S. renter households already sit.[1] It is survivable short-term, but it leaves very little room for an emergency, a rent increase, or any other unplanned cost, which is exactly what an Emergency Fund Calculator is built to plan for.
If you are not sure which applies, start with Recommended (30%), compare it against current listings in your target area, and move to Conservative or Stretched based on what you find.
Every number below is computed by the same formula the calculator above uses.
Monthly gross income: $4,166.67. Recommended (30%) budget: $1,250.00/month ($15,000/year).
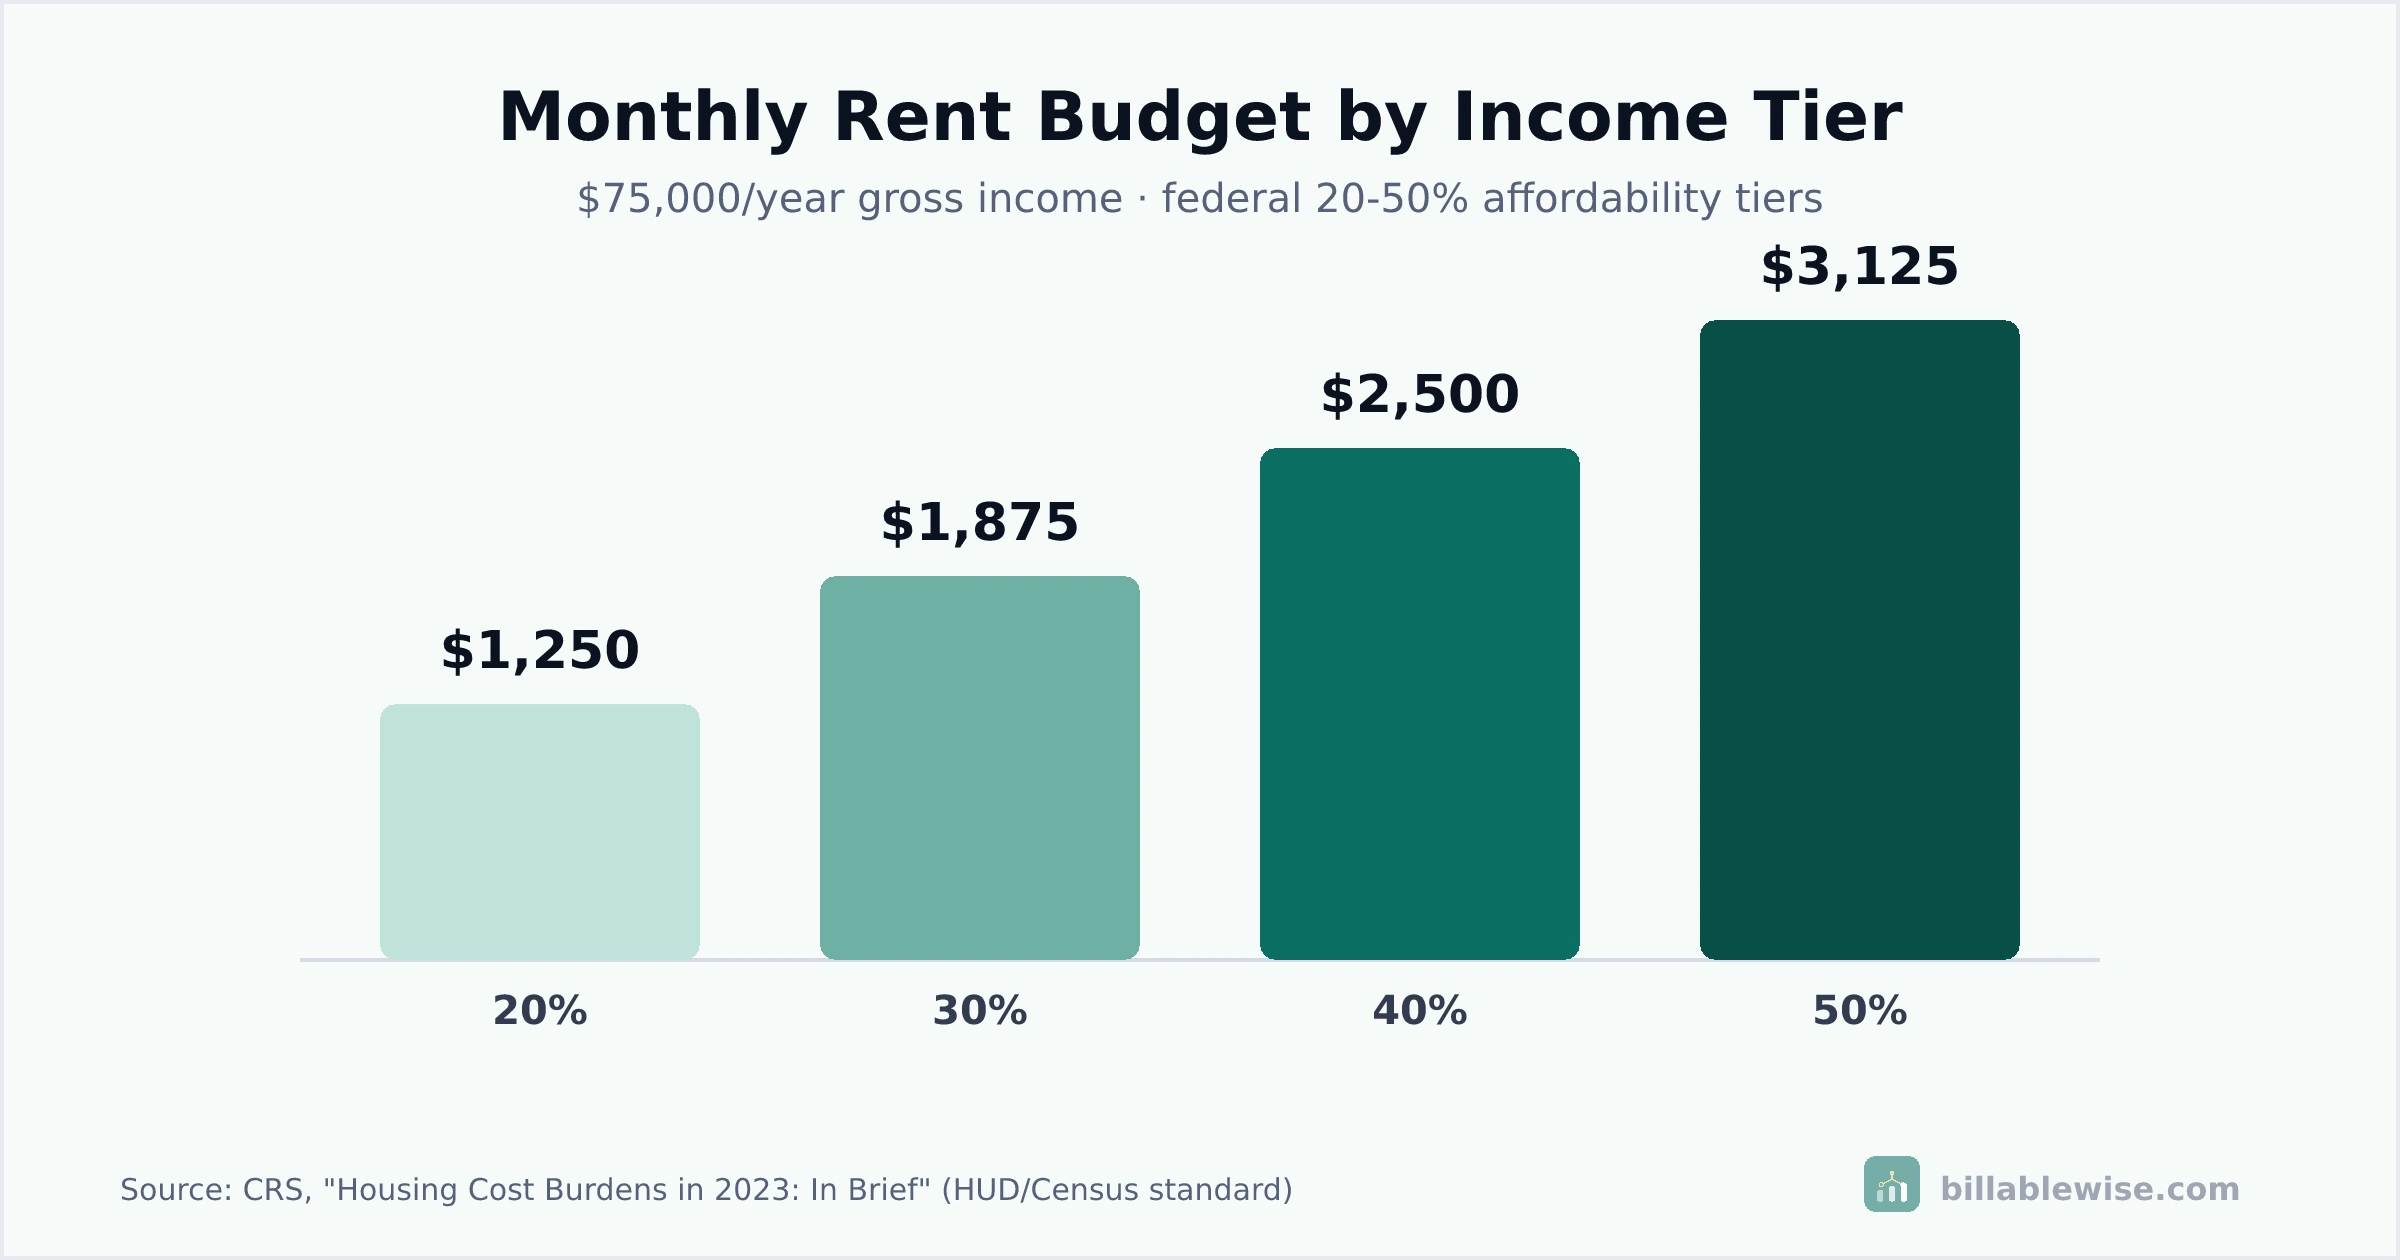
Monthly gross income: $6,250.00. Conservative $1,250.00/month, Recommended $1,875.00/month, Stretched $2,500.00/month, Severely Cost-Burdened Limit $3,125.00/month.
Entered directly as a monthly figure. Recommended (30%) budget: $1,350.00/month ($16,200/year).
Monthly gross income: $3,813.33. Recommended (30%) budget: $1,144.00/month ($13,728/year).
Monthly gross income: $8,333.33. Recommended (30%) budget: $2,500.00/month ($30,000/year).
A benchmark only helps if it changes what you actually do at the leasing office. Once you have a monthly figure from the calculator above, here is how to put it to work.
Some listings advertise base rent and bill utilities, parking, or a "amenity fee" separately. Ask for the full monthly total before comparing it to your budget, otherwise a unit that looks like it fits can push you into the next tier up once every fee is added.
Many landlords and property managers require annual income of at least 40 times the monthly rent, which lines up exactly with the 30% rule (see the FAQ below). If a unit's asking rent is above what your income qualifies for, save the trip and look at units in your actual tier instead.
A security deposit, first month's rent, and sometimes last month's rent all come due before you get your keys. That upfront cost is not part of your ongoing monthly budget, plan for it as a separate, one-time savings goal.
A raise, a job change, or a move to freelance income all change your number. Re-run the calculator whenever your income changes meaningfully rather than mentally adjusting an old figure, especially before signing a new lease.
Some leases, especially longer ones, build in a rent increase at a set date rather than at renewal. Check the lease terms for any scheduled increase and re-run your budget against that future number, not just the rate you would pay in month one, before signing a multi-year agreement.
Rent is usually the single biggest line item in a monthly budget, but it is not the only one. Once you know your rent number, our Grocery Budget Calculator can help you work out a realistic number for the next-biggest recurring cost.
Most renters do not end up cost-burdened because they chose an unreasonable apartment on purpose. They end up there for a handful of predictable, fixable reasons.
This calculator's percentages are built on gross income, matching the federal standard. Applying the same 30% to your take-home pay instead produces a budget that looks safer than it really is; if you want a net-income-based number, use a smaller percentage like Ramsey's 25%, not the standard 30%.
Renters insurance, parking, and utilities all add monthly costs on top of rent. A unit that hits your rent budget exactly can still push your total housing spending into cost-burdened territory once those extras are added.
Thirty percent of your income is a fixed dollar figure regardless of where you live, but what that figure actually rents varies enormously by city. Check listings in your target area before assuming your tier is achievable there.
A lease is usually a 12-month commitment. If your income is seasonal, commission-based, or likely to change, budget against a conservative estimate of your income rather than your best month, so a slow month does not put you over budget.
You do not have to choose between a better apartment and a responsible budget. For most renters, the realistic path is raising the number the calculator works from, not just accepting a smaller apartment.
Splitting rent, and often utilities, across two incomes instead of one is the single biggest lever most renters have. Run each person's income through the calculator separately, then use our Rent Split Calculator to divide the total fairly by income, room size, or an even split, rather than guessing at a proportion by hand.
Asking for a lower rate, a free month, or reduced fees is more common and more successful than most renters expect, especially on units that have been listed for a while. A one-time or ongoing discount directly improves your affordability without changing your income at all.
The same budget often reaches a meaningfully larger or better-located unit a short distance outside the most in-demand neighborhood. Weigh the commute cost against the rent savings before ruling an area out.
A raise, a side income stream, or a higher-paying role all raise every tier's dollar figure proportionally. This is a slower fix than negotiating or adding a roommate, but it is the only one that improves your budget without any tradeoff.
Rent increases at renewal are common, and a renewal offer above your original tier deserves the same scrutiny as a brand-new lease. Recalculate your budget against your current income before agreeing to a renewal rate, rather than assuming it still fits because it did last year.
Enter your income above (annual salary, monthly income, or hourly wage) and this calculator converts it to a gross monthly figure, then multiplies it by four affordability percentages: 20%, 30%, 40%, and 50%. The 30% figure is the federal government's own housing affordability threshold; the other three give you a tighter and a looser range around it.
Divide your annual salary by 12 to get gross monthly income, then multiply by 0.30 for the standard "30% rule" recommendation. For a $60,000 salary, that is $60,000 / 12 = $5,000/month, then $5,000 x 0.30 = $1,500/month. This calculator does that math automatically and also shows a conservative (20%) and stretched (40-50%) range.
A common starting point is 30% of your gross monthly income, the same threshold the federal government uses to define "affordable" housing. If you want more room for savings or debt payoff, use 20-25% instead. Going above 30% is not unusual, especially in expensive metro areas, but above 50% is considered "severely cost-burdened" and worth avoiding if you have any flexibility.
It is the guideline that housing should cost no more than 30% of your gross income, the actual federal standard used to define "cost burdened" households, tracing back to the Brooke Amendment of 1969 and later federal housing law. See "How this calculator works" above for the full history.
In many high-cost cities, no, nearly half of U.S. renter households already pay more than 30% of their income toward housing. The rule is best treated as a benchmark for what "affordable" officially means, not a hard requirement every renter can hit. If your area's rents run higher, use the 40% "Stretched" tier as a more realistic planning number and prioritize keeping other costs down.
Dave Ramsey's guidance recommends capping total housing costs, including utilities, at 25% of take-home (net) pay, which is stricter than the federal 30%-of-gross-income standard in two ways: a lower percentage, and applied to a smaller income base (net instead of gross). If you want a Ramsey-style number, use this calculator's 20% tier as a close approximation, then subtract your average monthly utility cost from the result.
Many landlords require annual gross income to be at least 40 times the monthly rent. Mathematically, that is the same as the 30% rule: monthly rent = annual income / 40 works out to exactly 30% of monthly income. If a landlord's 40x requirement rejects you, your rent request is, by definition, above the standard 30% affordability line.
No. This calculator estimates base rent only. Utilities, renters insurance, and parking (where charged separately) are housing costs on top of rent, budget for those separately and be aware that some official "cost burden" statistics measure gross rent, meaning rent plus utilities, which is a stricter number than rent alone.
Yes, this calculator works for anyone regardless of rental history. If you have never rented before, start with the 20-30% range rather than stretching toward 40-50%, since a first apartment often comes with upfront costs (deposit, application fees, furniture) that a more experienced renter has already absorbed.
Yes, this calculator is completely free with no account or download required, and it works in any mobile or desktop browser. Bookmark this page or add it to your phone's home screen for quick access while apartment hunting.
This calculator uses gross (pre-tax) income, matching the federal affordability standard it is based on. Your actual spending power is your net (take-home) pay, which is lower once taxes, insurance, and retirement contributions come out. Treat the calculator's numbers as a ceiling, then check that your net income comfortably covers rent plus every other bill before signing a lease.
Run each roommate's income through the calculator separately, then split the total rent in proportion to each person's recommended budget rather than splitting it evenly if incomes are uneven. Two roommates earning $40,000 and $80,000 a year do not have equal ability to pay, even though a landlord usually only cares about the combined household total.
The 20-50% percentages apply everywhere; they are a share of your own income, not a location-specific dollar figure. What changes by city is how much rent your income actually buys: the same $1,875 recommended budget stretches much further in a lower cost-of-living area than it does in Manhattan or downtown Chicago. Use the percentage as your rule and local listings to see what it buys where you live.
The underlying percentages (especially the 30% affordability line) come from U.S. federal housing policy, but the same math works anywhere: multiply your gross monthly income by 20-50% to get a comparable range. Renters in Canada, the UK, or elsewhere can use this as a rule-of-thumb starting point, though local housing agencies may publish their own official affordability thresholds worth checking too.
That means you are spending more than half your gross income on rent, HUD's "severely cost-burdened" line. It happens, especially in expensive markets or during a temporary income drop, but it leaves very little room for savings, emergencies, or debt payoff. Look at reducing rent (a smaller unit, more roommates, a different neighborhood) or increasing income before treating it as a stable long-term budget.
The 30% federal affordability threshold has been stable since 1983 and is not revised annually the way a price index is. This calculator's underlying source, a Congressional Research Service report analyzing U.S. Census data, is updated periodically as new American Community Survey data is released; check the reference link below for the most recent edition.
For getting a quick, sourced rent budget number, yes, this calculator does the same math a spreadsheet formula would, instantly and without setup. A spreadsheet is still useful for tracking your actual monthly spending against that number over time, which this calculator does not do.
The same income-based percentages apply to any rental, house or apartment. Houses often cost more in absolute dollars because of extra square footage, a yard, or a garage, so a house that fits your 30% tier in one market might only be available at the 40% tier in another. Compare the calculator's dollar figure against real listings for the property type you want, not just apartments.
This calculator does not factor in debt directly, but lenders and many landlords do: a common underwriting guideline caps total monthly debt payments, rent plus loans, credit cards, and car payments, at 36-43% of gross income, the same debt-to-income ratio used in mortgage approvals. If you carry significant student loan or car payments, treat this calculator's Conservative or Recommended tier as your target rather than Stretched, since your other debt is already claiming part of that room.